Reports and analytics
Tickiti includes a set of built-in reports for understanding ticket volumes, response times, agent activity and resolution outcomes. They are at Reports in the main navigation, and require admin access plus the has_reports plan capability.
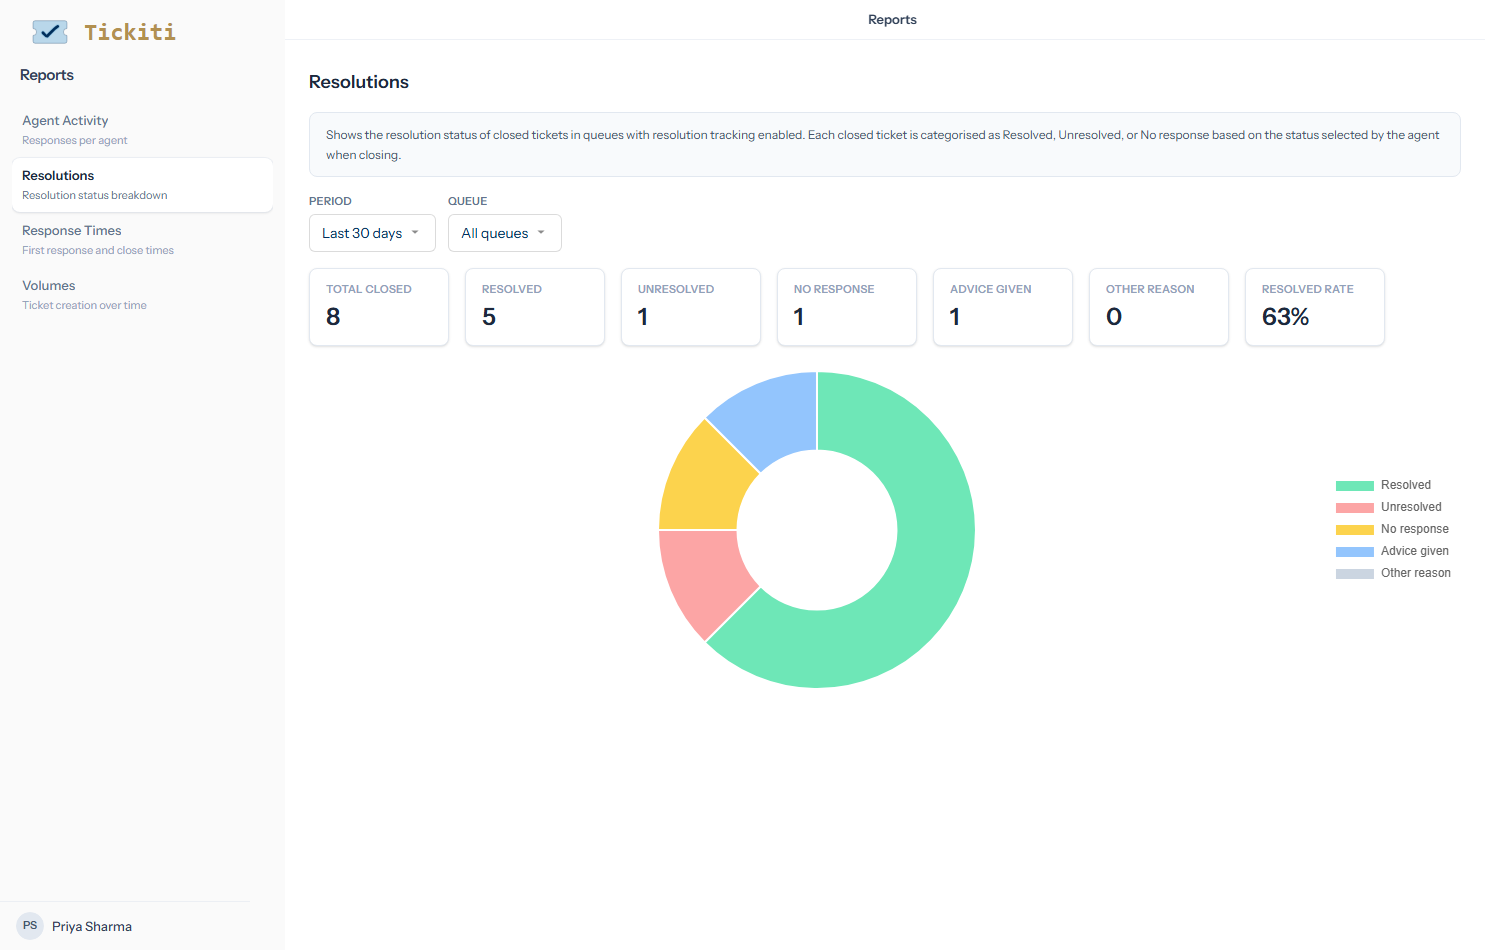
The reports
- Volumes — tickets created over time, broken down by queue. Useful for spotting demand spikes or seasonal patterns.
- Response Times — the time-to-first-public-response and time-to-close, by queue and date range. The numbers most people mean by “how fast are we?”.
- Agent Activity — responses per agent, by date range. Use as input to coaching, not as a leaderboard. A single number does not capture handling complexity.
- Resolutions — for queues with resolution tracking enabled, the breakdown of closed tickets across the resolution categories (out of the box: Resolved, Unresolved, No response, Advice given, Other reason) plus a resolved rate. The closure-quality lens.
Common controls
Each report has at minimum:
- Period — Last 30 days by default, with quick presets and a custom range.
- Queue — All queues or one specific queue. Compare two queues by running the report twice in adjacent tabs.
Most reports render a chart and the underlying numbers as a table. The CSV-export option below the table downloads the raw data if you want to pivot it elsewhere.
Reading the numbers
- Response time medians beat means — one ticket left until Friday afternoon can pull a mean far up. The median is closer to the typical experience.
- Watch for changes, not absolutes. A response-time of 4 hours is not good or bad in isolation; a jump from 2 hours to 4 hours over a week is a flag.
- Volumes versus capacity. A 30% volume increase with the same response time is good news; the same response time with 30% fewer tickets means something is slipping.
- Resolutions nuance. A high Unresolved rate is sometimes a queue setup issue (people closing tickets without picking the resolution), not a quality issue. Cross-check with a sample.
Reports + perspectives + watchlists
Reports tell you what has happened. Perspectives and watchlists show what is happening right now. The combination is the supervisor toolkit:
- Reports for trend-finding and review meetings.
- Perspectives for live workflow monitoring and impersonation views.
- Watchlists for hand-curated oversight of named cases or projects.
Going further with your own tools
The API exposes ticket and response data, so any view you want to build — custom dashboards, board reports, weekly snapshots in your BI tool — you can pipe out and assemble there. See API overview in the Integrations section.